Documentation:
Download:
Licence:
What is SIED ?
SIED is a free and open-source software to analyse Secondary Ion Mass Spectrometry (SIMS) isotope images.
Scientific background :
SIED, Significant Isotopic Enrichment Detection is a tool designed to help the analysis of Secondary Ion Mass Spectrometry (SIMS) isotopic images. In such isotopic analysis, at least 2 isotopes are imaged, i.e. one image represents the localization of one isotope and an other image represents the localization of another isotope, with the relative abundances of the two isotopes are assumed to be constant in “unenriched” samples. This can be exemplified by the analysis of 12C14N- and 12C15N- for which the relative abundance of 12C15N=12C15N/(12C14N+12C15N) is close to 0.0037.
SIMS analysis leads to the counting of secondary ions, i.e. a (small) fraction of the two isotopes from the sample, and incidentally to statistical fluctuations in the measure of the relative isotopic abundances. Depending on the total amount of detected secondary ions (counting statistics), the statistical fluctuations induce a “noise” that has to be compared to the measure. The less the counting statistics, the less the measure/noise ratio and incidentally that the more difficult is the detection of small enrichments in one of the two isotopes due to sample labeling.
The aim of SIED is to solve this problem by comparing the measured isotopic abundances to the expected statistical fluctuations (that depends on the counting statistics) for each pixel of the images. For more details, the principle of SIED calculations has been published in (Delaune et al., 2013).
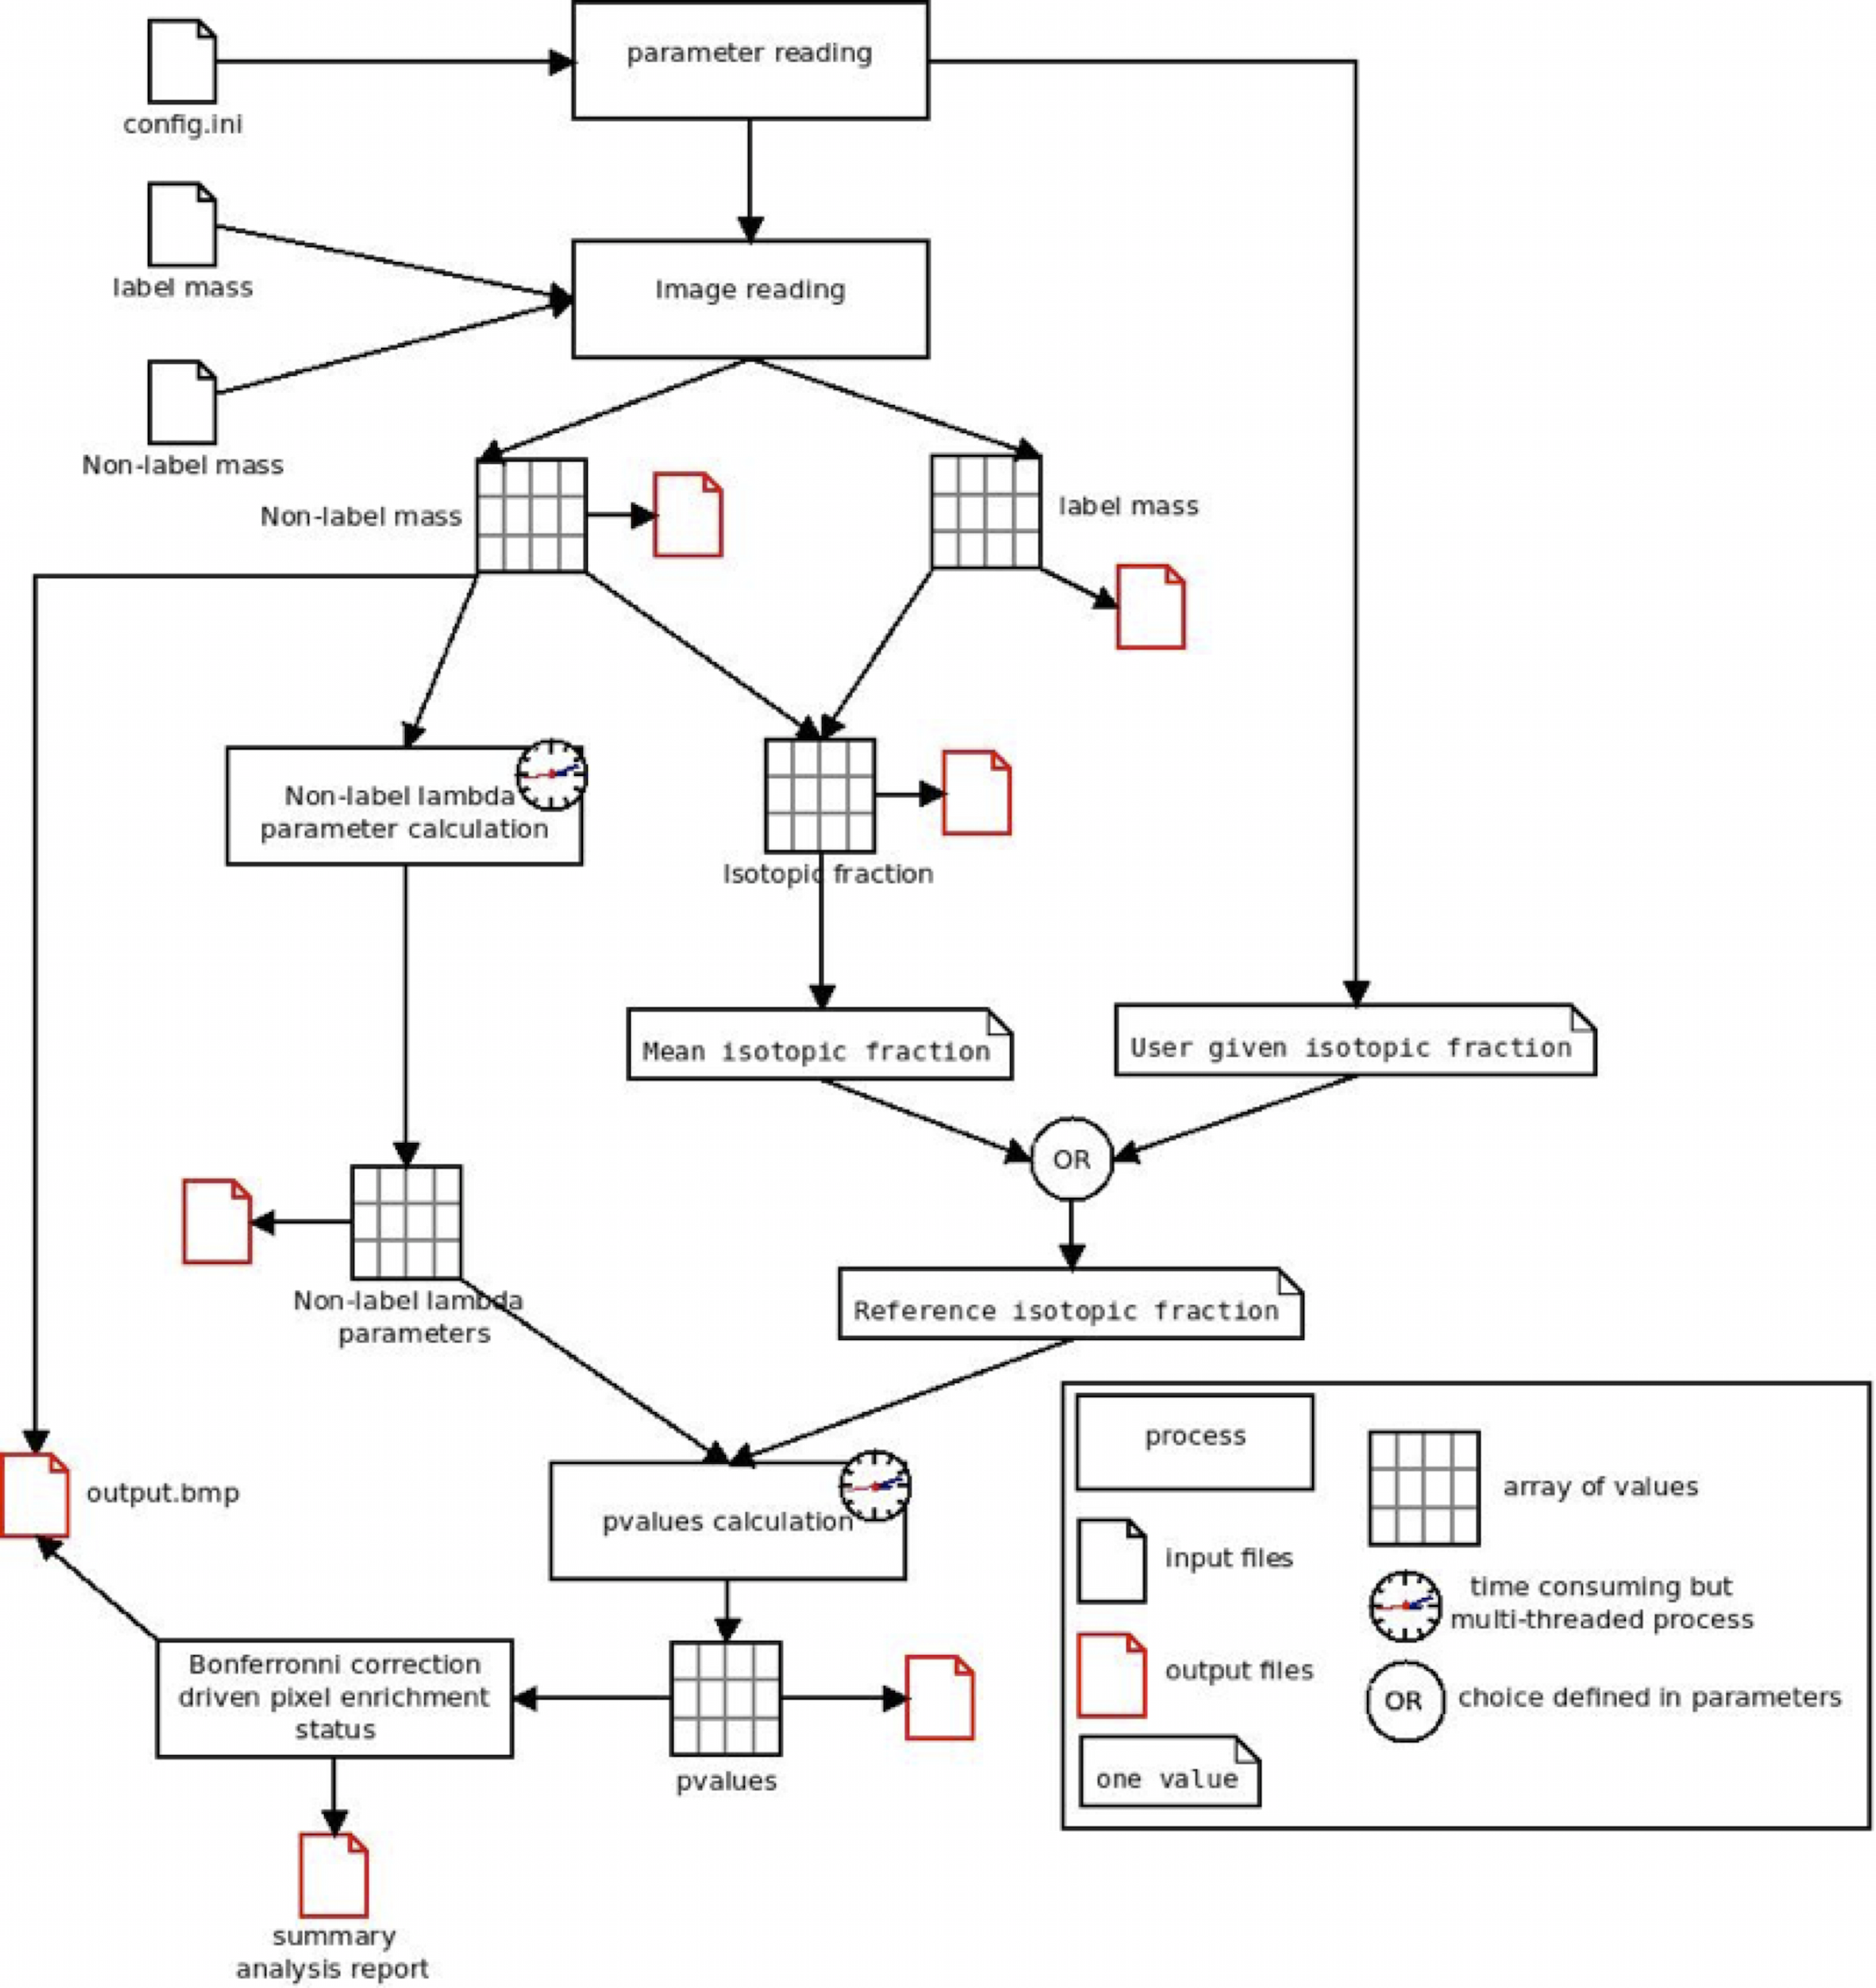
Briefly, as illustrated, SIED opens the configuration file (namely config.ini) that contains the analysis parameters. From these parameters, there are the name of the file corresponding to the image of the isotope designated as “label mass” (12C15N in the previous example) and the name of the file corresponding to the image of the other isotope designated as “non-label mass” (12C14N in the previous example). When SIED opens these files, it convert the images in arrays where each cell corresponds to a pixel of the original images. SIED then calculates the isotopic fraction for each pixel (and creates a new array) and then the mean isotopic fraction of the image. This value can be used as a reference isotopic fraction, i.e., the isotopic fraction that is considered as the real value of the sample and from which, pixels with significantly different value will be searched. Alternatively, the reference isotopic fraction can be entered by the user as a parameter. To estimate the stochastic distribution of the measured isotopic fraction arround the reference isotopic fraction, the counting statistics is estimated. From the non-label mass array, SIED computes the lambda parameter for each pixel. For each pixel, the method consist in researching the value of lambda parameter that maximizes the sum of Poisson probabilities (probability to obtain the measured value with this lambda value) of the neighboring pixels. The extension of the neighboring is defined in the config.ini file as the rank of the matrix, i.e., the distance (in pixels) around the analyzed pixel. Clearly, a rank 0 means the analyzed pixel alone is taken into account, a rank 1 means the 9 pixels of the squared centered on the analyzed pixel are taken into account, rank 2 means the 25 pixels etc... The quadratic effect of the rank on the number of calculation explains why this step is time-consuming. Hopefully, SIED is multi-threaded. Once the array of lambda parameters is calculated, the pvalues, i.e. (in simplified terms) the probability that the measured isotopic fraction is not different than the reference, are computed. Once again, this step is time-consuming but accelerated by multi-threading. Finally, a statistical test is performed (using Bonferronni correction for multiple test) to assess whether each pixel is significant or not, and output files are saved.
By extension, in the case of isotopically-enriched samples in which a local variation in enrichment (local higher enrichment or local lower enrichment compared to the average enrichment of the sample) has to be assayed, a similar calculation can be done (two-tailed test).
Analysis preparation step :
SIED requires the images are in a text format. Each pixel value has to be a positive integer (no decimal separator). The pixels have to be separated by a tabulation.
In addition to images to be analyzed, SIED requires parameters for the analysis. These parameters have to be stored in a file (traditionally named config.ini) that will be read by SIED.
The analysis parameters can be manually edited in the config.ini file. However, to analyze a NanoSIMS50 image, it is strongly recommended to use SIED_maker (on Linux system) or SIEDmaker4win.exe (on Windows sytem) to generate this file (see SIEDusersguide.pdf for more information).
See Linux installation or windows installation to install these software and then SIED and information for execution of SIED.
Licence :
This program is free software: you can redistribute it and/or modify it under the terms of the GNU General Public License as published by the Free Software Foundation, either version 3 of the License, or (at your option) any later version.
This program is distributed in the hope that it will be useful, but WITHOUT ANY WARRANTY; without even the implied warranty of MERCHANTABILITY or FITNESS FOR A PARTICULAR PURPOSE. See the GNU General Public License for more details.
A copy of the license text is included in the download package.
Contact :
For more informations or any questions contact :
Anthony Delaune
Laboratoire GPM UMR CNRS 6634 – Equipe NanoCARE Faculté des Sciences et Techniques Université de Rouen AVENUE DE L'UNIVERSITE CS 70012 76801 ST ET. DU ROUVRAY CEDEX France
ou anthony.delaune@univ-rouen.fr

